Text Summary via OCR:
on packaging research, this is a rather impressive figure. The average investment by all industry in all research and development, including product, has been recently estimated2 at 1.7% of the sales dollar. This would indicate that packaging alone accounts for more than one-sixth of the total research investment. And in non-durable goods alone (which account for the bulk of packaging activity), on the basis of government figures for total manufacturers' sales in 1957, the total expenditure in this country on packaging research could be projected to about $519 million.
To take one company as an example: General Foods, the nation's largest manufacturer of packaged foods, has just reported publicly for the last year $1 billion in sales and a $10-million annual total research expenditure. If the 0.304% average figure indicated by our survey were to be applied to General Foods it would mean that $3 million per year goes for packaging research in just this one company. That would be three-tenths, rather than one-sixth, of the total research budget, which is not illogical in a company which is said to spend 7 cents of every sales dollar for packaging materials.
Survey method arid scope
The 1,074 companies invited to participate in this survey included 936 primarily consumer-goods firms and 138 primarily industrial- or non-consumer-goods manufacturers. To insure that the survey and analysis would be conducted by professional standards, Modern Packaging retained a leading market-survey firm with considerable experience in the packaging field.3
Following the pilot test by personal interview, the questionnaire was compiled and sent by direct mail, employing a single, non-follow-up mailing of (1) a personalized letter addressed to an executive of each company and requesting referral to the person chiefly responsible for packaging, (2) a printed four-page questionnaire and (3) a business-reply envelope for the return of completed questionnaires.
The return was made direct to the survey firm and Modern Packaging was not identified as the interested party. Although respondents were asked to give their name, title and company name, they were assured that the final report would not reveal the identity of any person or firm.
Without any follow-up mailings there were 96 workable responses, an effectual return of approximately 9%. The numerical size of this return leaves open the probability of a 10% error, plus or minus. Nevertheless, as the survey firm points out, this
2By the investment firm of Dominick & Dominick, New York.
3Don Vhite, Inc., 52 Vanderbilt Ave., New York 17.
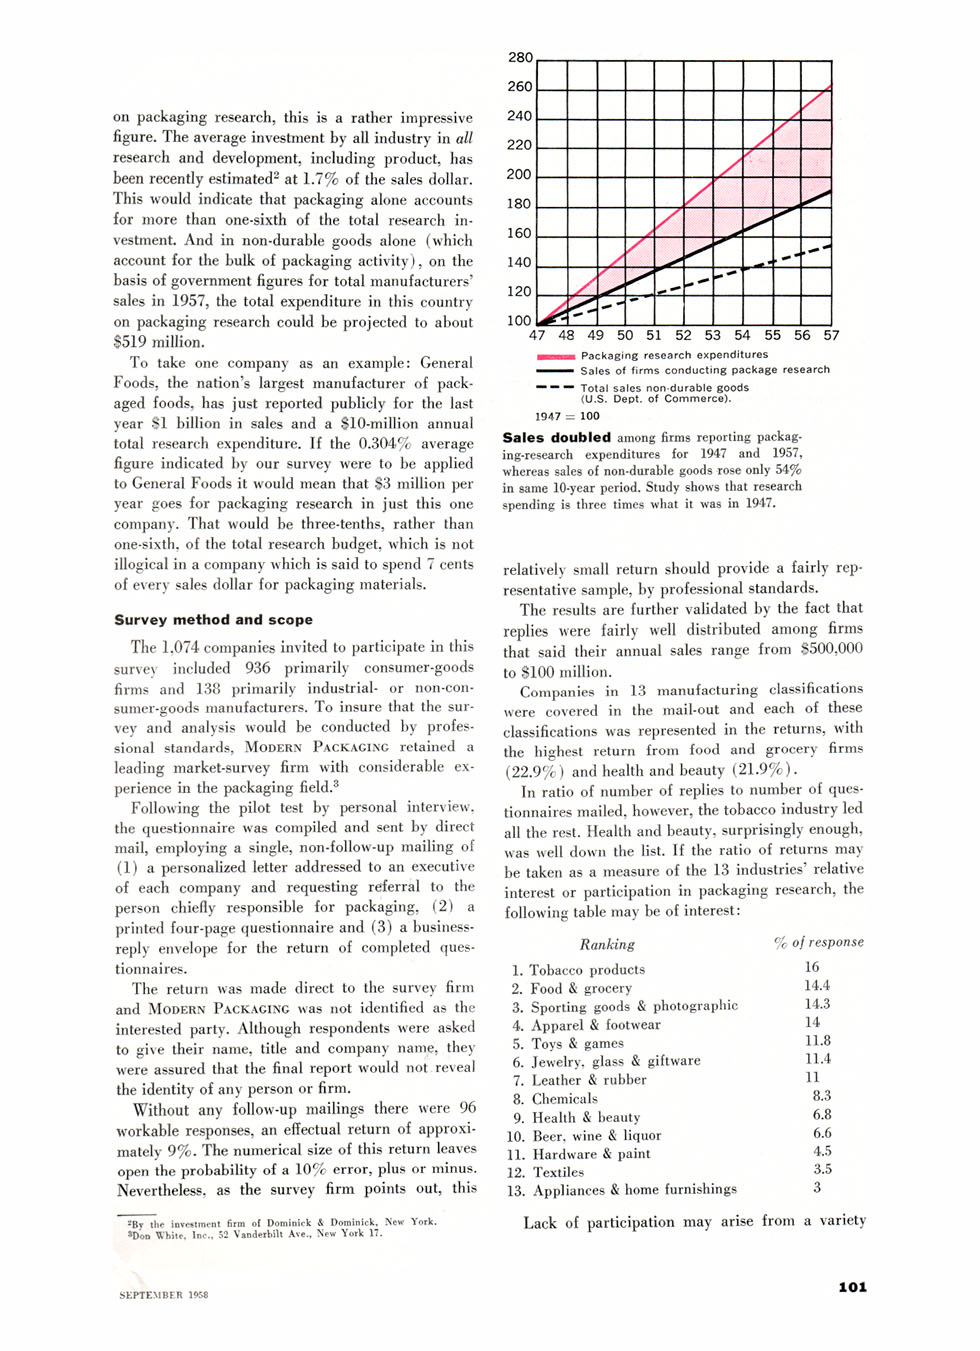
47 48 49 50 51 52 53 54 55 56 57
wmwMM. Packaging research expenditures ....... Sales of firms conducting package research
" Total sales non-durable goods (U.S. Dept, of Commerce).
1947 = 100
Sales doubled among firms reporting packaging-research expenditures for 1947 and 1957, whereas sales of non-durable goods rose only 54% in same 10-year period. Study shows that research spending is three times what it was in 1947.
relatively small return should provide a fairly representative sample, by professional standards.
The results are further validated by the fact that replies were fairly well distributed among firms that said their annual sales range from $500,000 to $100 million.
Companies in 13 manufacturing classifications were covered in the mail-out and each of these classifications was represented in the returns, with the highest return from food and grocery firms (22.9%) and health and beauty (21.9%).
In ratio of number of replies to number of questionnaires mailed, however, the tobacco industry led all the rest. Health and beauty, surprisingly enough, was well down the list. If the ratio of returns may be taken as a measure of the 13 industries' relative interest or participation in packaging research, the following table may be of interest:
|
Ranking |
% of response |
|
1. Tobacco products |
16 |
|
2. Food & grocery |
14.4 |
|
3. Sporting goods & photographic |
14.3 |
|
4. Apparel & footwear |
14 |
|
5. Toys & games |
11.8 |
|
6. Jewelry, glass & giftware |
11.4 |
|
7. Leather & rubber |
11 |
|
8. Chemicals |
8.3 |
|
9. Health & beauty |
6.8 |
|
10. Beer, wine & liquor |
6.6 |
|
11. Hardware & paint |
4.5 |
|
12. Textiles |
3.5 |
|
13. Appliances & home furnishings |
3 |
Lack of participation may arise from a variety