VINTAGE OWNER'S MANUALS, SERVICE MANUALS, BROCHURES AND PUBLICATIONS
Welcome to Automatic Ephemera, an independent organization/library for historical research and education, sharing public domain manuals, brochures and periodicals relating to vintage products.
Text Summary via OCR:
truded under four different conditions. The resins which were involved were:
|
|
Melt index |
Density |
|
|
(gm./10 min.) |
( gm.lcc.) |
|
Resin A |
1.6 |
0.922 |
|
Resin B |
2.0 |
0.922 |
|
Resin C |
3.0 |
0.920 |
|
Resin D |
3.0 |
0.930 |
|
The resins conditions: |
were extruded under the following |
|
Compound temperatures, 215 deg. Flat film 54 in. wide |
C. |
|
Extrusion condi |
Roll speed |
Stretch dis |
|
tion designation |
( f.p.m.) |
tance (in.) |
|
(1) |
60 |
1 |
|
(5) |
80 |
1 |
|
(8) |
80 |
4 |
|
(12) |
120 |
4 |
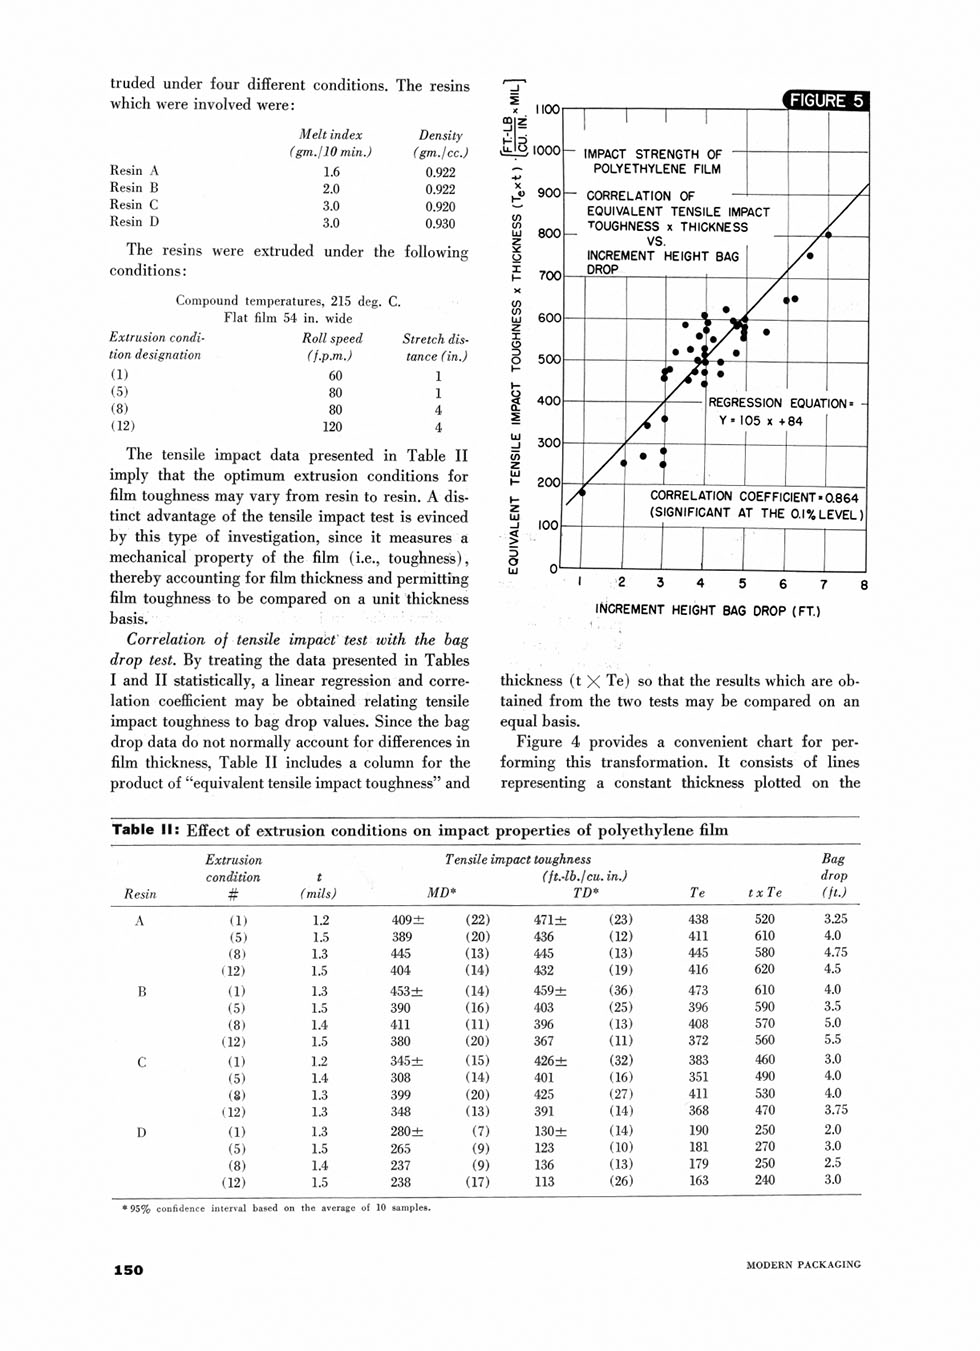
The tensile impact data presented in Table II imply that the optimum extrusion conditions for film toughness may vary from resin to resin. A distinct advantage of the tensile impact test is evinced by this type of investigation, since it measures a mechanical property of the film (i.e., toughness) , thereby accounting for film thickness and permitting film toughness to be compared on a unit thickness basis.
Correlation of tensile impact test with the bag drop test. By treating the data presented in Tables I and II statistically, a linear regression and correlation coefficient may be obtained relating tensile impact toughness to bag drop values. Since the bag drop data do not normally account for differences in film thickness, Table II includes a column for the product of "equivalent tensile impact toughnes-ť and
2
X
op Z
: 3 . O
X
in
if)
LU
Z
*
o
if)
in
LU
z
X
s
o
in
z
UJ
z
Ui
-J
I
o
100
|
|
1-1 1 |
r |
|
|
|
|
ImrAU 1 bl KtlNu 1 H
POLYETHYLENE Fll
CORRELATION OF EQUIVALENT TENSI TOUGHNESS x THIC |
OF
LM |
|
|
|
|
LE IMPACT 5KNESS |
/ |
1_ |
|
VS.
INCREMENT HEIGH1 k DROP |
r BAG |
|
|
|
|
1 |
|
|
i |
|
/ l |
»• |
|
|
|
|
|
ft
ft
• • ! |
1
*/ * /_ ft |
[ • |
|
|
|
| |
|
|
*
/ 1 |
> # ft
1
REGRE
Y s t |
SSION 05 x + |
EQUAT
84 |
ION = - |
|
i |
|
/ < |
•ş |
|
|
/ « |
• 1 4 |
>
i |
|
|
|
|
|
|
|
cc
(S |
IRRELATION COEFFICIENT*0.864 IGNIFICANT AT THE 0.1%LEVEL) |
|
J |
|
|
|
|
|
|
|
1 2 3 4 5 6 7 8
INCREMENT HEIGHT BAG DROP (FT.)
thickness (t X Te) so that the results which are obtained from the two tests may be compared on an equal basis.
Figure 4 provides a convenient chart for performing this transformation. It consists of lines representing a constant thickness plotted on the
Table II: Effect of extrusion conditions on impact properties of polyethylene film
Extrusion Tensile impact toughness Bag
|
Resin |
condition
# |
t
( mils) |
MD* |
|
(ft.-lb./cu.
TD* |
in.) |
Te |
txTe |
drop
(ft.) |
|
A |
(1) |
1.2 |
409 ± |
(22) |
471± |
(23) |
438 |
520 |
3.25 |
|
|
(5) |
1.5 |
389 |
(20) |
436 |
(12) |
411 |
610 |
4.0 |
|
|
(8) |
1.3 |
445 |
(13) |
445 |
(13) |
445 |
580 |
4.75 |
|
|
(12) |
1.5 |
404 |
(14) |
432 |
(19) |
416 |
620 |
4.5 |
|
B |
(1) |
1.3 |
453 ± |
(14) |
459± |
(36) |
473 |
610 |
4.0 |
|
|
(5) |
1.5 |
390 |
(16) |
403 |
(25) |
396 |
590 |
3.5 |
|
|
(8) |
1.4 |
411 |
(11) |
396 |
(13) |
408 |
570 |
5.0 |
|
|
(12) |
1.5 |
380 |
(20) |
367 |
(11) |
372 |
560 |
5.5 |
|
C |
(1) |
1.2 |
345± |
(15) |
426± |
(32) |
383 |
460 |
3.0 |
|
|
(5) |
1.4 |
308 |
(14) |
401 |
(16) |
351 |
490 |
4.0 |
|
|
(8) |
1.3 |
399 |
(20) |
425 |
(27) |
411 |
530 |
4.0 |
|
|
(12) |
1.3 |
348 |
(13) |
391 |
(14) |
368 |
470 |
3.75 |
|
D |
(1) |
1.3 |
280± |
(7) |
130 ± |
(14) |
190 |
250 |
2.0 |
|
|
(5) |
1.5 |
265 |
(9) |
123 |
(10) |
181 |
270 |
3.0 |
|
|
(8) |
1.4 |
237 |
(9) |
136 |
(13) |
179 |
250 |
2.5 |
|
|
(12) |
1.5 |
238 |
(17) |
113 |
(26) |
163 |
240 |
3.0 |
â…ś 95% confidence interval based on the average of 10 samples.
ISO